[★★★☆☆] Double Edge Notched Specimen
The double edge notched specimen was investigated by Nooru-Mohamed (1992).
This example is taken from the thesis. The details of the model can be seen in Section 6.3.
The model can be downloaded here.
Model Setup
The definitions of nodes and elements can be seen in element_f.supan and node_f.supan.
To ease the work of defining boundary conditions and load, some node groups can be defined first.
In total four edges will be used, here the generatebypoint command is used to find all relevant nodes.
The boundary conditions are explicitly assigned to the corresponding node groups.
| Text Only | |
|---|---|
Two displacement loads are applied. Two files h and v are used to define the amplitudes.
| Text Only | |
|---|---|
If VTK is enabled, it is possible to record the distribution of tension damage at each converged substep.
| Text Only | |
|---|---|
Since we are not interested in the displacement, scale is simply set to zero. The output file are automatically
numbered with a total width of four. It is changed to three in this example. The generated .vtk files can be loaded
into ParaView as a group to generate animations.
The analysis has a duration of two seconds. In the first second, the horizontal tension is applied, then the vertical load is applied.
| Text Only | |
|---|---|
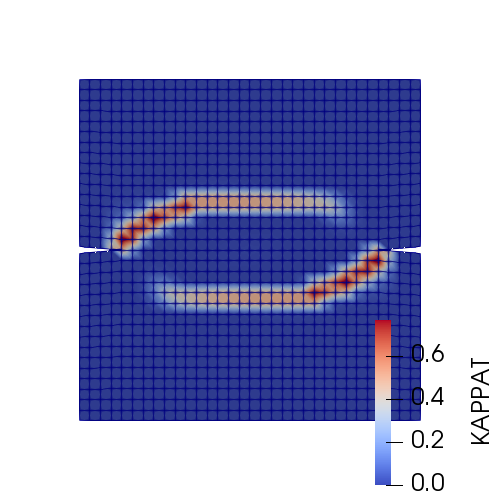
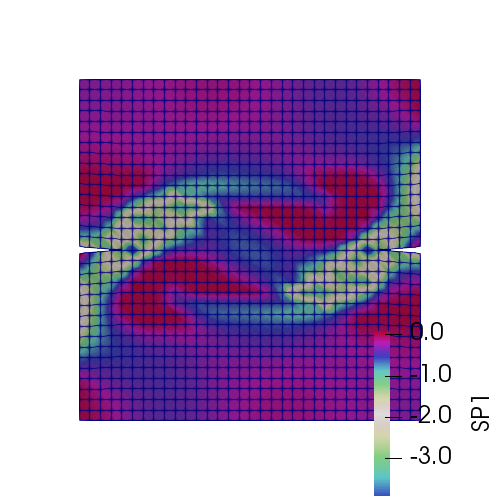
Results
Results are shown as follows, which agree with experimental results.
Element Deletion
It is possible to further define a criterion so that for elements that exceed a certain value of \(\kappa_t\), they are removed from the model. This is an approach adopted widely to simulate crack propagation.
| Text Only | |
|---|---|
The animation of crack development is shown as follows.